
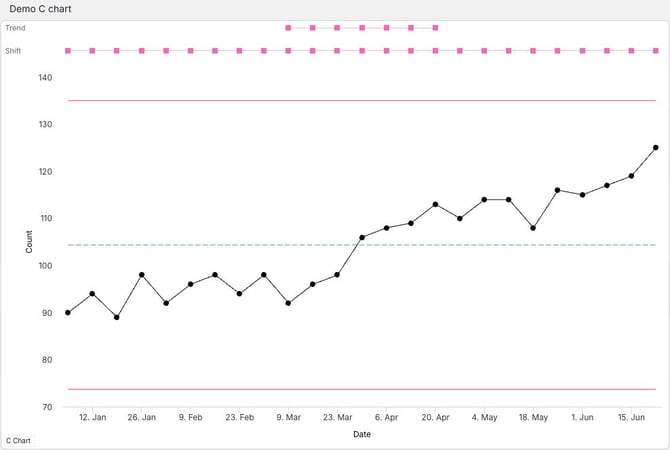
Horizontal gridlines help you read values across the Y axis. On a control chart, they can also make the chart look cluttered alongside the data line, centre line and upper and lower control limits.
You can hide the gridlines from the chart’s Configure menu. This changes the chart’s appearance without changing your data or control limits.
- Open the chart.
- Click ‘Configure’ in the top right of the chart.
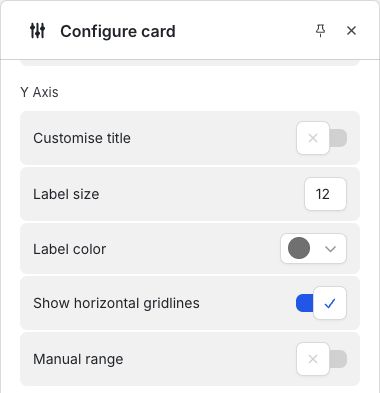
- In the ‘Appearance’ section, scroll down to ‘Y Axis’.
- Turn off the ‘Show horizontal gridlines’ switch. The gridlines disappear from the chart immediately.
- Close the Configure panel using the ‘X’ in its top right.
Find the switch in the Y Axis section:
Your chart with horizontal gridlines hidden:
To show the gridlines again, return to the same setting and turn the switch on.